2-Line Trend Comparison Chart | Dual Data Animation with Soft Bars
ByDescription
This clean and effective animation features two contrasting line charts over a subtle bar background, designed to compare trends across 5 key data points. Ideal for showcasing differences between campaigns, user behaviors, or performance over time. Use it in sections like Causal Comparison, Dynamic Trend Analysis, or Performance Breakdown. Perfect for financial storytelling, product comparison, or social media metrics in faceless YouTube content or business presentations.
Details
10s
1920x1080
5 texts
1 image
Similar Animations

5-Point Line Chart Animation with Subtle Bar Background

2 Data Set Comparison | Monthly Trend Line Animation

Line Chart Animation with Highlighted Data Point | Trend Visualization

4-Bar Chart Animation with Labels | Clean Data Comparison Visual
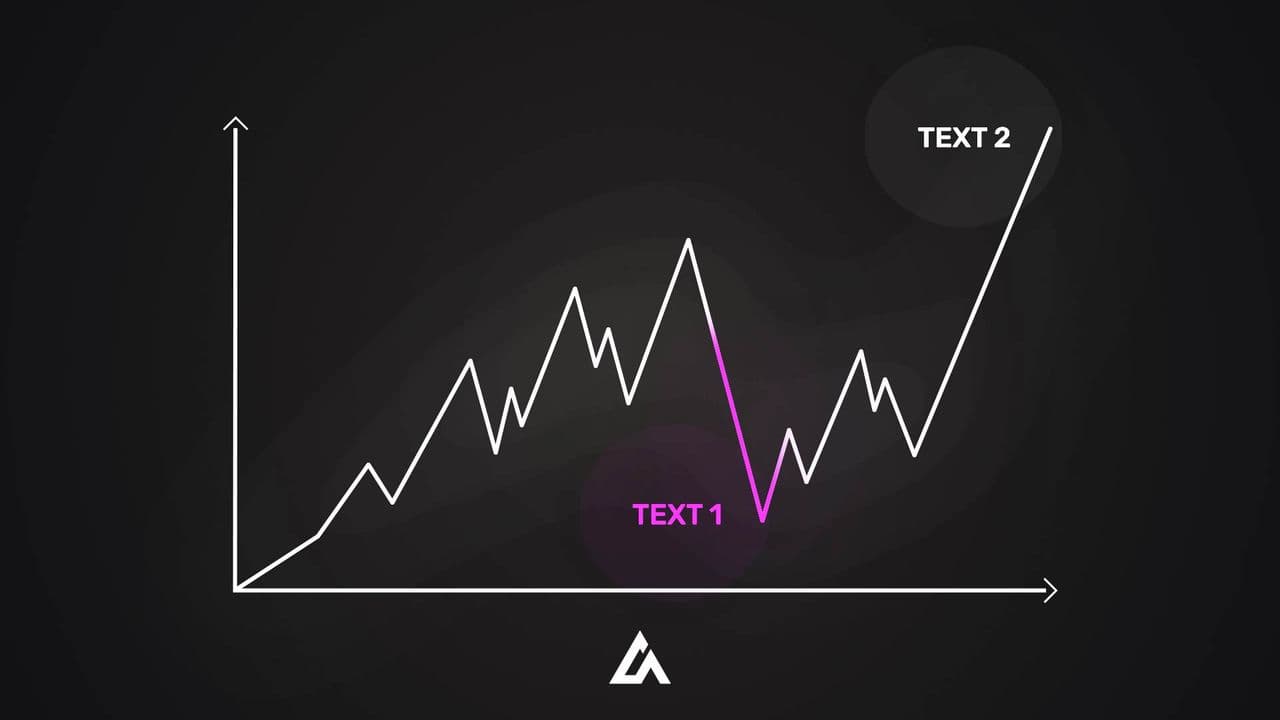
Chart Comparison Animation | Data Drop vs Growth Highlight

Chart Comparison Animation | Data Drop vs Growth Highlight

Chart Animation with Smooth Descent

4 Dual-Bar Comparison Animation | Horizontal Data Split
More Hooks By Moeinedits

UI Selector Animation: Highlight from 1 Scrolling Text List

UI Selector Animation: Highlight from 1 Scrolling Text List

Documentary Map Animation: Pinpoint 3 Photo Locations

Documentary Map Animation: Pinpoint 3 Photo Locations

News Print Highlight Animation: Spotlight 1 Key Quote or Headline

News Print Highlight Animation: Spotlight 1 Key Quote or Headline

Character Success Story: Financial Reveal

Character Success Story: Financial Reveal
More Animated Flowchart Templates

Floating Phone + 3 Text Bars | Red Data Chart Reveal Animation

Growth Curve Reveal with Custom Text

Apple-Style Glass Animation | 3-Part Puzzle for Tech Concept Breakdown

5-Image Board Animation | Seamless Documentary-Style Photo Reveal

6-Step Process Animation | Clean & Structured Workflow Reveal

Dual Segment Ring Chart Animation | 2-Part Data Breakdown

4 Circular Progress Animations | Full Stage Percent Rings
